 Home
Home Links
Links About
About


Thursday, November 14, 2019
Script Release ::: hurdat2parser
hurdat2parser intakes, interprets, and outputs results based from the HURDAT2 file. HURDAT2 is a database of all tracked storm systems in the North Atlantic Ocean from 1851 to last year. Amongst kept data for each storm are winds at the center of circulation, mean sea-level pressure, and latitude and longitude coordinates of the center of the storm.


Wednesday, November 13, 2019
Script Release ::: Climate Parser
Climate Parser is a Python script which allows one to run quick analyses on US-city-specific climate data.

Wednesday, January 23, 2019
Geometry Corner :: Octagon Measurements
So recently in making some levels for a game (for fun), I encountered the need to create octagonal shapes. I started thinking about the regular octagon. So here I'll go over some requirements for one and a way to breakdown its make-up, the subsequent creation of related formulas, and measurements.
● ● ●
Tuesday, March 20, 2018
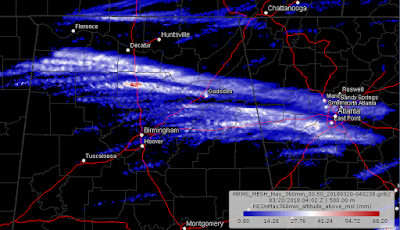
MRMS Products - Learning and Using
Multi-Radar Multi-Sensor (MRMS) products conglomerate radar information from hundreds of locations and intake other data sources as well, including lightning information. It results in over 100 frequently-updated accessible products.
● ● ●
Saturday, January 27, 2018
Skew-T / Log-P Diagram ::: The Paper Calculator (Part 3/3) ::: Inferences and Signals
In this segment, I'll briefly go over some information about inferences and signals forecasters look for while analyzing a sounding. This post is rather in-depth, so I'd recommend taking it in one section of a time. Please feel free to follow along (previous post has a link to a skew-t).
● ● ●
Friday, January 12, 2018
Skew-T / Log-P Diagram ::: The Paper Calculator (Part 2/3) ::: Basic Calculations
In this post, I'll highlight some simple uses of the Skew-T; ones that only need basic data. So you can practice with different values. Feel free to follow along using a blank skew-t. This one was my favorite to use during my education. You can print it out or open it up in a Paint program to work with if you want.
Click Above to Retrieve Your Own Skew-T.
Courtesy: Wikipedia (which cites their source as UMBC, University of Maryland-Baltimore County)
● ● ●
Sunday, December 31, 2017
Skew-T / Log-P Diagram ::: The Paper Calculator (Part 1/3)
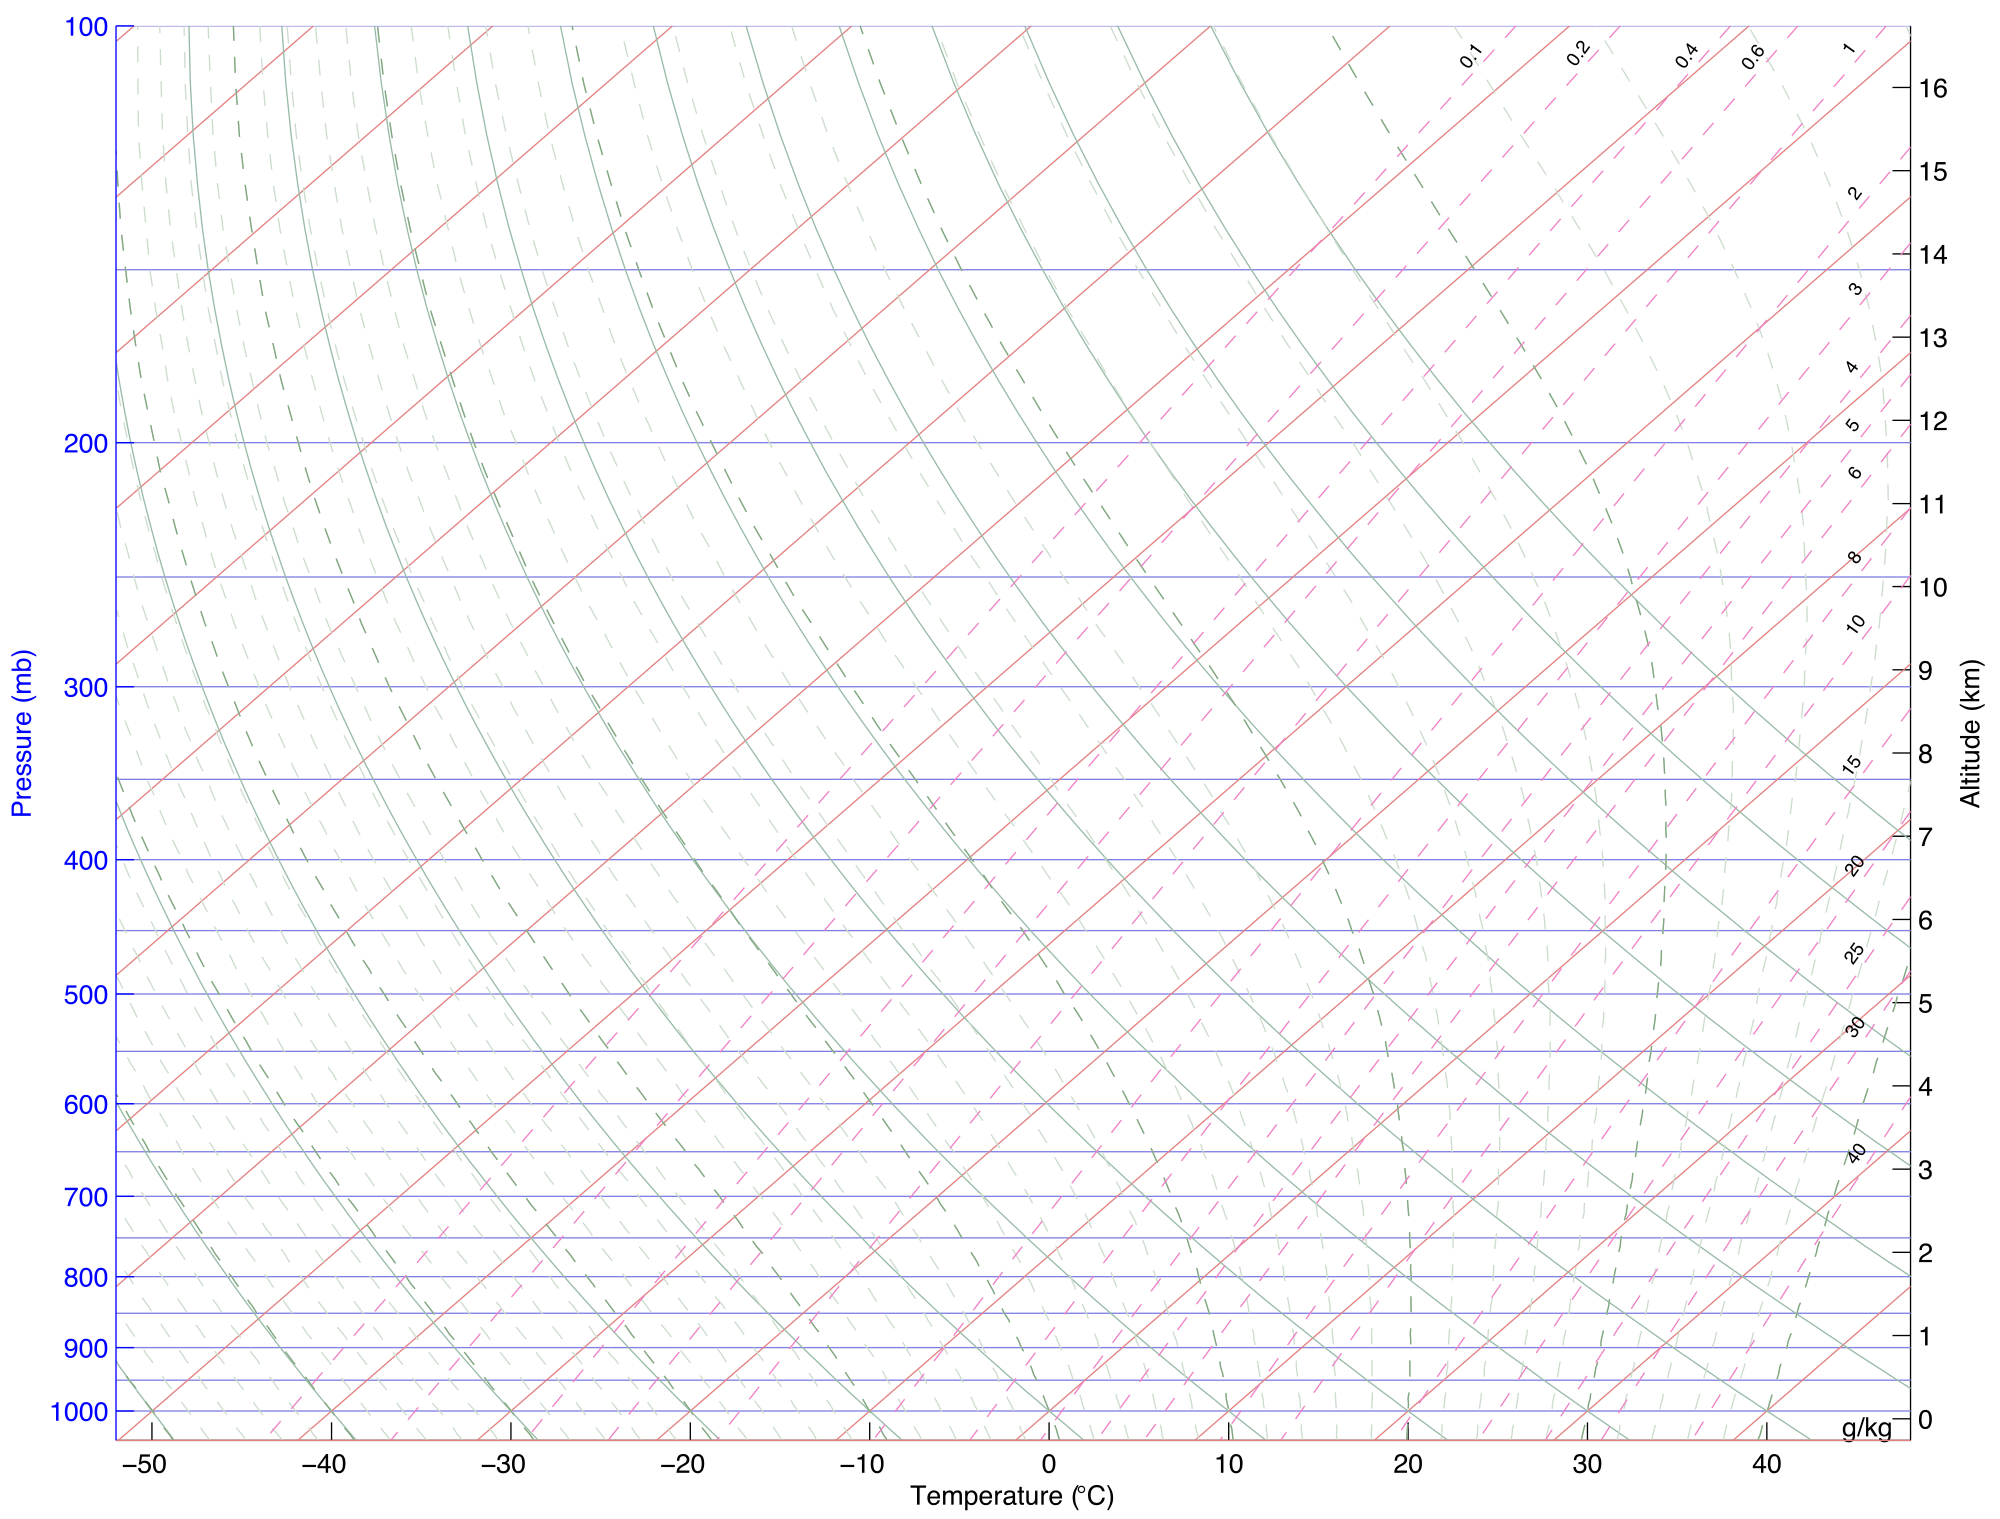
Referred hereafter primarily as "Skew-T's," and sometimes, 'soundings,' these diagrams / graphs play a significant role in meteorology. They are used to plot readings from weather balloons (called soundings) which allow the meteorologist to assess the entire state of the atmosphere (troposphere, primarily): from temperature, dew-point, and wind profiles to thunderstorm probability and severe-weather / winter-weather likelihood. Furthermore, you don't really need to have any real data on a blank graph. You can use it for theoretical purposes or basic calculations using limited info on the ground, hence me calling it, 'The paper calculator.'

Looking at a plotted, or even a blank Skew-T will look very busy and confusing at first. Therefore, in my first post about them, I'll go over the many different lines and what they are used for. Then in my 2nd post I will briefly overview some simple calculations that can be made using them with little-to-no assistance of other tools. The 3rd part will focus on inferences that can be made and signals that are watched for. I'll also conclude with my experience of discovering Skew-T's and how they changed things for me in my education.
Photo Courtesy: ShareMyJoys.WordPress.com
Looking at a plotted, or even a blank Skew-T will look very busy and confusing at first. Therefore, in my first post about them, I'll go over the many different lines and what they are used for. Then in my 2nd post I will briefly overview some simple calculations that can be made using them with little-to-no assistance of other tools. The 3rd part will focus on inferences that can be made and signals that are watched for. I'll also conclude with my experience of discovering Skew-T's and how they changed things for me in my education.
● ● ●
Subscribe to:
Posts (Atom)