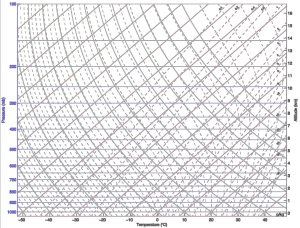
* Theoretical Situation: Surface pressure ~ 1000hPa (or mb) ::: Temp ~ 20 °C ::: Dew-Point ~ 10 °C
* Find the Lifting Condensation Level (LCL)
- Just using the information above, we can find the lowest level at which clouds will be able to form.
- I'll list the brief instructions here, but feel free to use the following as a guide:

Finding the LCL
- Plot the correct points on your Skew-T; From the temperature, use the dry-adiabatic guides and sketch parallel to them, ascending in height; do the same from the dew-point except going parallel with the mixing-ratio lines
- Mark their intersecting point. This is the point where clouds can begin to form, or in other words, where condensation typically can first occur if parcels or bubbles of air can be lifted to this level. You can say what pressure level this will occur at AND approximately how high in the atmosphere this will happen (remember that heights don't perfectly correlate to pressure-levels but can be used as guides).
- You'll notice that larger dew-point depressions (difference in air temperature and dew-point) will yield higher LCL's in addition to signalling drier weather. Large dew-point depressions are common in deserts where it is often too dry for clouds to form in the lower-levels.
- Limitations: This won't tell you any information about the temperatures above the surface, which frequently determine whether or not clouds will form. Additionally, any cloudiness you do see may be occurring in the mid-levels or upper-levels and could've simply advected over the area.
* Finding the Wet-Bulb Temperature
- Finding this temperature will tell you a number of things. From simple summer-time expectations to potentially-vital implications for an incoming winter-storm.
- We'll use the same theoretical data as the prior example:

Finding the Wet-Bulb
- Find the LCL using the process from the previous step
- Make note of the saturated adiabat guides
- From the LCL, descend toward the ground parallel to the saturated adiabats. The temperature you find that intersects the ground is the Wet-Bulb Temperature!
- What this shows is, barring any other factors, the coolest temperature that can be reached from precipitation, a process called 'evaporative cooling.' As it rains, the drier air below acts to evaporate the falling precipitation. But it does so at the expense of available heat-energy. In-turn, the evaporation acts to moisten the air below, increasing dew-points and lowering air temperatures.
- The wet-bulb near the surface can be an approximate indicator of how much temperatures can fall due to precipitation. In the winter, they can be used to predict precipitation phase changes, like from rain to snow.
- Limitations: Using just the wet-bulb doesn't account for many typical processes, like moisture or temperature advection, the passing of frontal or outflow boundaries, diurnal-heating, or radiational-cooling.
Other Tricks
Find the Relative Humidity
(Needed - Temperature, Dew-Point, Basic Calculator)
- Scenario: The evening news just came on and you were told that the temperature is 77 °F (25 °C) and that the dew-point is 61 °F (~ 16 °C) with surface pressure reading 1000mb...
Calculating Relative Humidity via the Temperature and Dew-Point
- After plotting the temperature and dew-point, find the respective mixing ratios by tracing parallel to the mixing-ratio guides. Dew-Point will be related to the actual mixing-ratio (W) while the Temperature will be used to reveal the Saturation Mixing Ratio (Ws).
- Calculate the relative humidity: RH (%) = 100 * W / Ws
- You should get a value around 55% relative humidity.
- The smaller the dew-point depression, the higher the relative humidity. The temperature just will identify the mixing-ratio needed for saturation to occur. It can disguise the situation at the surface though as temperature is highly variable, being subject to heating of the day/cooling at night, etc. The dew-point is primarily a moisture parameter. Most of the time, relative-humidity at the 11:00 news will be higher than at the 6:00 news but the moisture content (mainly referring to the dew-point) in the air may not have changed at all between those times. That said, relative humidity in the mid and upper levels is frequently used to assess the moisture situation aloft as temperature is less subject to diurnal fluctuations at those altitudes.
Find Dew-Point
(Needed - Temperature, Relative Humidity, Basic Calculator)
- Scenario: We'll slightly change the previous case, but this time we don't know the dew-point. That said, you just watched the late-night news and the meteorologist just informed you that it was 68 °F (20 °C) with a RH of 77%. Again assume the pressure at the surface is 1000mb...
Calculating the Dew-Point from known surface Temperature and Relative Humidity
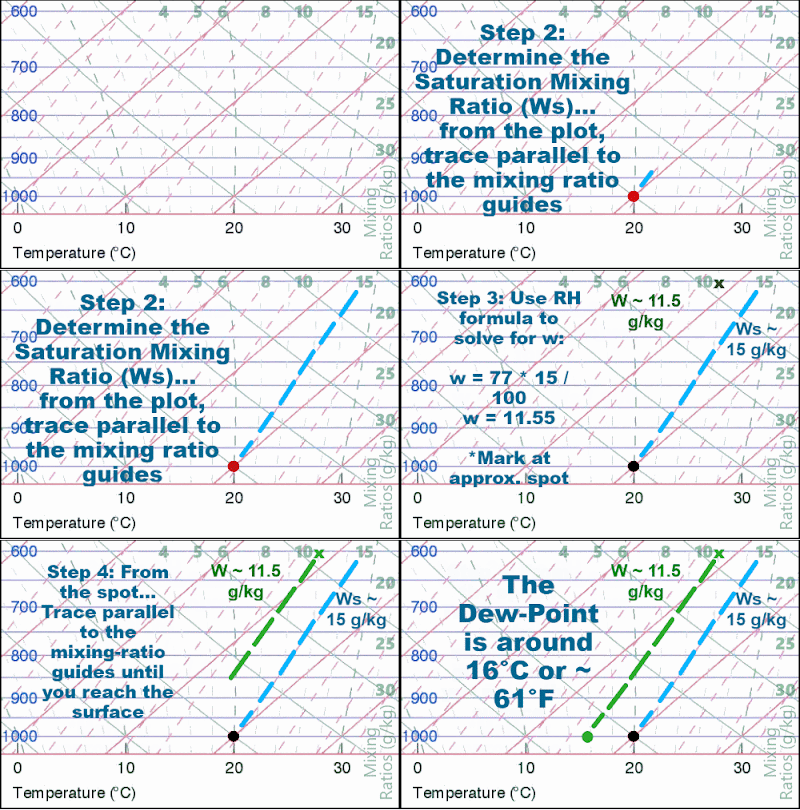
- Find the Saturation Mixing-Ratio (Ws): After plotting the air temperature, go parallel to the mixing-ratio lines, and you'll find that Ws is around 15 g/kg.
- Using the RH equation, employ some algebra to solve for the mixing-ratio (W):
----- W = RH * Ws / 100
----- W = 77 * 15 / 100 ... this yields a W of ~ 11.5 g/kg.
- Find the Dew-Point: After marking the approximate mixing-ratio, trace parallel to the mixing-ratio lines down to the surface-level. You'll get an answer around 16 °C or ~61 °F.
- Make note that this is the exact same dew-point as the previous hypothetical example. As explained in the previous section, both situations exhibit the same dew-points but significantly different relative humidity readings. The air temperature difference is the culprit. The like-dew-points tell us that the moisture content in the air at the surface has exhibited negligible change.
Thank you for taking the time to allow me to go through these highlights. From these previous examples, you can infer that more can be determined from a skew-t than I went over, albeit not quite as useful. Some of these things include:
Known: Surface Pressure, Dew-Point (or mixing-ratio), and LCL → You can find out Air Temperature, Wet-Bulb, or the Relative Humidity
Known: Surface Pressure, Dew-Point (or mixing-ratio), and Wet-Bulb → You can find out Air Temperature, LCL, or Relative Humidity
Known: Surface Pressure, Air Temperature (or saturation mixing-ratio), LCL → You can find out the Dew-Point, Wet-Bulb, or the Relative Humidity
Known: Surface Pressure, Air Temperature, Wet-Bulb → You can find out the Dew-Point, LCL, or the Relative Humidity
We've also discussed at least one inference you can take-away from a blank graph, namely, pressure decreasing with height. But there are a number of things that a graph with no data on it can be used to visualize and infer other relationships between variables. In my third installment, I'll be going over these inferences.
Next Post → Inferences and Signals


No comments:
Post a Comment