Saturday, September 19, 2020
Unofficial Current Year/Season HURDAT2 Data Output
I've been working on sprucing up my HURDAT2 Parser program (python) a lot lately. Though the new version is unreleased, one method I've been working on is ranking of partial seasons; allowing a specific date to be set, so you could see the most impressive seasons up to a arbitrary point (a month/day). This would also allow ranking of partial data.
Thursday, November 14, 2019
Script Release ::: hurdat2parser
hurdat2parser intakes, interprets, and outputs results based from the HURDAT2 file. HURDAT2 is a database of all tracked storm systems in the North Atlantic Ocean from 1851 to last year. Amongst kept data for each storm are winds at the center of circulation, mean sea-level pressure, and latitude and longitude coordinates of the center of the storm.
Wednesday, November 13, 2019
Script Release ::: Climate Parser
Climate Parser is a Python script which allows one to run quick analyses on US-city-specific climate data.
Wednesday, January 23, 2019
Geometry Corner :: Octagon Measurements
So recently in making some levels for a game (for fun), I encountered the need to create octagonal shapes. I started thinking about the regular octagon. So here I'll go over some requirements for one and a way to breakdown its make-up, the subsequent creation of related formulas, and measurements.

● ● ●
Tuesday, March 20, 2018
MRMS Products - Learning and Using
Multi-Radar Multi-Sensor (MRMS) products conglomerate radar information from hundreds of locations and intake other data sources as well, including lightning information. It results in over 100 frequently-updated accessible products.

● ● ●

Saturday, January 27, 2018
Skew-T / Log-P Diagram ::: The Paper Calculator (Part 3/3) ::: Inferences and Signals
In this segment, I'll briefly go over some information about inferences and signals forecasters look for while analyzing a sounding. This post is rather in-depth, so I'd recommend taking it in one section of a time. Please feel free to follow along (previous post has a link to a skew-t).
● ● ●
Friday, January 12, 2018
Skew-T / Log-P Diagram ::: The Paper Calculator (Part 2/3) ::: Basic Calculations
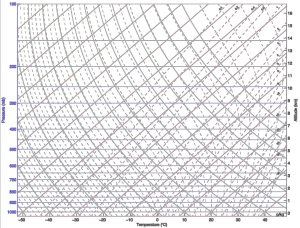
In this post, I'll highlight some simple uses of the Skew-T; ones that only need basic data. So you can practice with different values. Feel free to follow along using a blank skew-t. This one was my favorite to use during my education. You can print it out or open it up in a Paint program to work with if you want.

Click Above to Retrieve Your Own Skew-T.
Courtesy: Wikipedia (which cites their source as UMBC, University of Maryland-Baltimore County)
● ● ●

Subscribe to:
Comments (Atom)


