● ● ●
Saturday, January 27, 2018
Skew-T / Log-P Diagram ::: The Paper Calculator (Part 3/3) ::: Inferences and Signals
In this segment, I'll briefly go over some information about inferences and signals forecasters look for while analyzing a sounding. This post is rather in-depth, so I'd recommend taking it in one section of a time. Please feel free to follow along (previous post has a link to a skew-t).
Friday, January 12, 2018
Skew-T / Log-P Diagram ::: The Paper Calculator (Part 2/3) ::: Basic Calculations
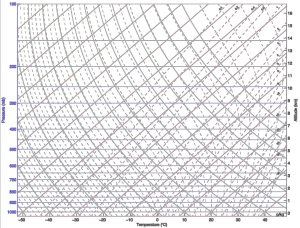
In this post, I'll highlight some simple uses of the Skew-T; ones that only need basic data. So you can practice with different values. Feel free to follow along using a blank skew-t. This one was my favorite to use during my education. You can print it out or open it up in a Paint program to work with if you want.

Click Above to Retrieve Your Own Skew-T.
Courtesy: Wikipedia (which cites their source as UMBC, University of Maryland-Baltimore County)
● ● ●

Subscribe to:
Comments (Atom)

